What did you learn? I learned how to incorporate video into Figma to recreate an AR-style app.
What was easy? It was easy to come up with an idea for the app because Delaware Park has many points of interest to choose from.
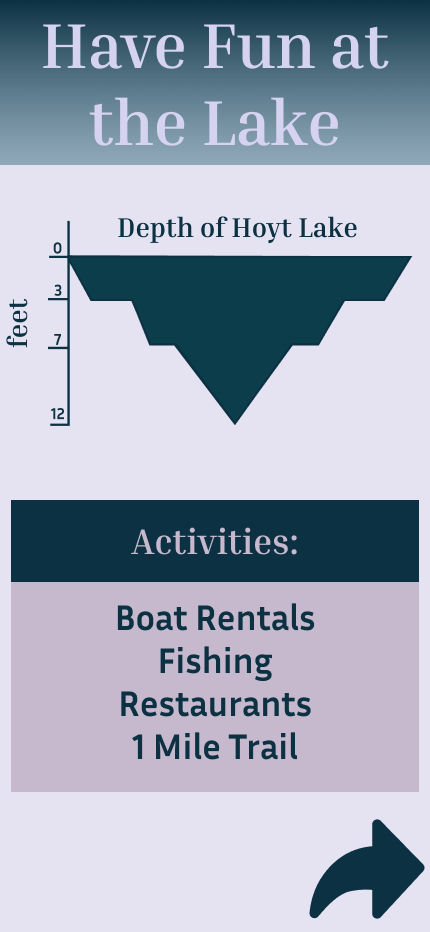
What was challenging? It was challenging to come up with infographics as I couldn’t find much online regarding statistics. I worked around this by using what I already knew and displaying it in a graph.
How could your submission be improved? I could have made the learn more buttons better by making them change colors when you pressed down on them.
How could the professor improve the assignment for the next class? This project was well explained and I liked the introduction to video and incorporating it into Figma. The AR was a unique idea.
How might you apply your knowledge in future assignments or work scenarios? In the future, I will be required to use Figma for other assignments and work-related scenarios, so it is always great to learn new things about the program.
How did a specific reading or video inspire or help you? This article helped me better understand what infographics really were and why they’re important. It also made me realize why infographics and data visualization should be incorporated into projects so statistics can be read visually.


